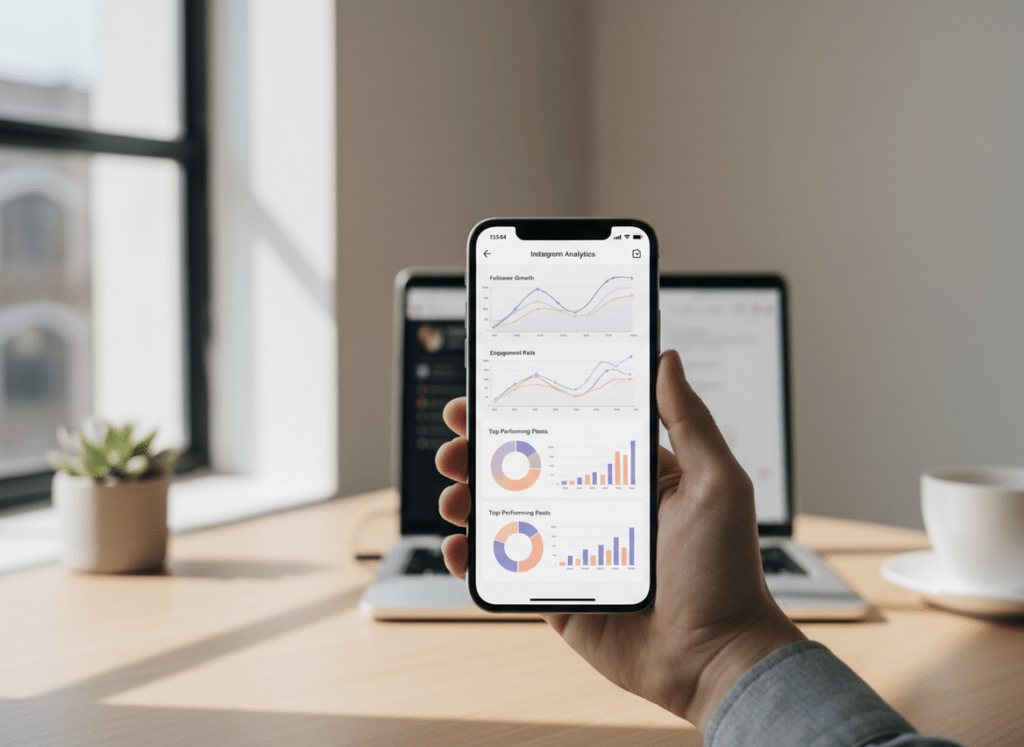
Reports apps and instagram engagement analytics tools can show you follower patterns you’ll never catch by casually scrolling your notifications. The hidden stuff is usually simple: who quietly stopped engaging, what content pulls “Saves” (not just likes), and which follower changes line up with specific posts.
I’ve tested a bunch of these tools across creator accounts, small businesses, and one annoyingly large brand account where everything loads slower and the data gets “chunky” (you’ll see what I mean). The short version: start with native Instagram Insights for clean baseline numbers, then add a reporting app when you need exports, benchmarks, and follower-change context.
And yeah, the game changed again in 2026. Suggested content and Reels distribution matter more than your posting schedule ever did, so your “reports” are less about vanity metrics and more about diagnosing why reach spikes… or dies.
TL;DR: Reports apps and engagement analytics tools unveil deeper follower insights beyond surface-level metrics, like engagement patterns and content performance. I’d start with Instagram Insights for the basics, then bring in a reporting app once you want exports and a little more context around what changed and when. In 2026, things kinda slid toward suggested posts and Reels getting pushed around, so yeah, paying attention to how your audience behaves matters a lot if you want engagement to move.
What “hidden follower insights” actually means (and what it isn’t)
Most people think follower analytics is just “follower count went up, cool.” That’s surface-level. Hidden insights are just the patterns behind the follower count. Like follower churn, you’re gaining people, but you’re also losing about the same number every week, so it feels like you’re going nowhere.
- Quiet non-engagers: followers who stay but stop interacting, dragging down your average engagement rate.
- Content-to-change mapping: which post or Reel happened right before a drop, or which format reliably pulls new follows.
- Audience quality signals: not “are they real,” but “are they the type of real person who will ever buy, click, or share?”
What it isn’t: a magical app that tells you “Instagram shadowbanned you” with 100% certainty. If a tool claims that, I’m already skeptical. Been burned by that exact promise before.
How reports apps and engagement analytics tools work (the simple mechanics)
At a basic level, instagram engagement analytics tools pull data from Instagram’s available interfaces (your account’s insights data, connected permissions, and reporting endpoints) and then repackage it in ways Instagram doesn’t bother with.
The two big data buckets
- Performance data: reach, impressions, plays, profile visits, website taps, saves, shares, story exits, story completion, etc.
- Relationship data: follower growth over time, unfollows, mutuals vs non-mutuals, and engagement distribution across followers.
The reason third-party reporting tools feel “smarter” is they’ll do the annoying parts: trend lines, comparisons, exports, tagging campaigns, and benchmarking.
One counterintuitive thing nobody tells you: more detail doesn’t automatically mean better decisions. I’ve watched teams drown in 100+ metrics and still miss the one that mattered (usually Saves per Reach or Shares per Reach on Reels).
If you’ve ever wondered how “Instagram Insights vs trackers” fits into this whole picture, this breakdown on native Instagram insights compared with third-party trackers explains why different tools can show different slices of truth.
The metrics that actually expose follower behavior in 2026
Engagement is flatter than most people expect right now. The average Instagram engagement rate sits around 0.48% in 2026, and it hasn’t moved much year over year. (If you want the math and what “good” looks like by account size, this explanation of how to calculate and interpret Instagram engagement rate is the cleanest reference.)
Stop obsessing over Likes. Watch these instead.
- Saves: the “I want this later” signal. This one correlates with long-term distribution more than people want to admit.
- Shares: the fastest way to get free reach from non-followers.
- Reels plays vs reach: plays can inflate; reach tells you unique accounts.
- Profile visits per post: tells you if content creates curiosity.
- Follows per piece of content: the only “growth” metric that ties to specific creative.
- Story completion rate: especially when you post multi-frame Stories. Drop-offs are a message.
Here’s a lived-detail thing I keep seeing: on smaller accounts (under 5k), a single Reel can make your “follows per post” look insane for 48 hours, then it normalizes hard. On bigger accounts, the numbers are steadier, but the insight is harder to spot because you’re averaging over so much content volume.
The reports apps I actually trust (and what each one is best at)
In 2026, the “top tool” question is messy because different tools win at different jobs. If you want my usual short list, it’s Instagram Insights, plus tools like Hootsuite, Sprout Social, Iconosquare, and Keyhole, depending on what you’re tracking.
Instagram Insights is your baseline, and it’s free, so you might as well start there. It’s accurate for what it shows. And it’s the first place I check when someone says “my reach tanked.”
But it’s also limited: exporting is a pain, historical comparisons are clunky, and you can’t benchmark against competitors.
Sprout Social (smart recommendations and team reporting)
Sprout’s AI suggestions for post timing and content themes are genuinely useful when you’re posting a lot. Not perfect. Useful.
I’ve also had Sprout catch sentiment shifts in comments during a campaign when I honestly didn’t notice it manually until it got worse. That saved me a headache.
Downside: pricing. At $99/user/month, it’s not a casual tool.
Hootsuite (multi-network dashboards, “good enough” analytics)
If you’re managing Instagram plus other platforms, Hootsuite keeps your reporting in one place. It’s not the deepest for IG-only nerd stats, but for operational reporting it works.
Iconosquare (deep IG metrics and competitor comparisons)
If you care about story completion, follower evolution by content type, and campaign labeling, Iconosquare is strong. I’ve used it when clients needed “weekly board slides” without me living in spreadsheets.
Real-world quirk: on accounts with lots of Stories per day, story analytics can take longer to populate in third-party tools. People panic and assume it’s broken. It usually isn’t. It’s just delayed.
Keyhole (live hashtag and campaign tracking)
Keyhole is the one I reach for when something is happening right now, like an event, a product drop, or a hashtag push. Live tracking matters more than perfect historical charts in those moments.
A quick note on “best of” lists
Most lists ignore data plumbing. If you plan to pull IG data into a dashboard, you’ll care a lot about integrations. This overview of building an Instagram analytics dashboard gets into the reality of connecting tools and exporting cleanly.
Where the “hidden insights” come from: 5 report views worth setting up
If you only do one thing after reading this, do this section. These report views are where the money is.
1) Follower change timeline with content overlays
Set up a timeline that shows daily follower net change, then annotate it with what you posted (Reel, carousel, Story-heavy day, collab, giveaway, etc.).
The reason it works is simple: Instagram distribution is spiky now. Suggested feeds can randomly amplify one Reel and make everything else look “bad” by comparison. Without a timeline, you blame the wrong post.
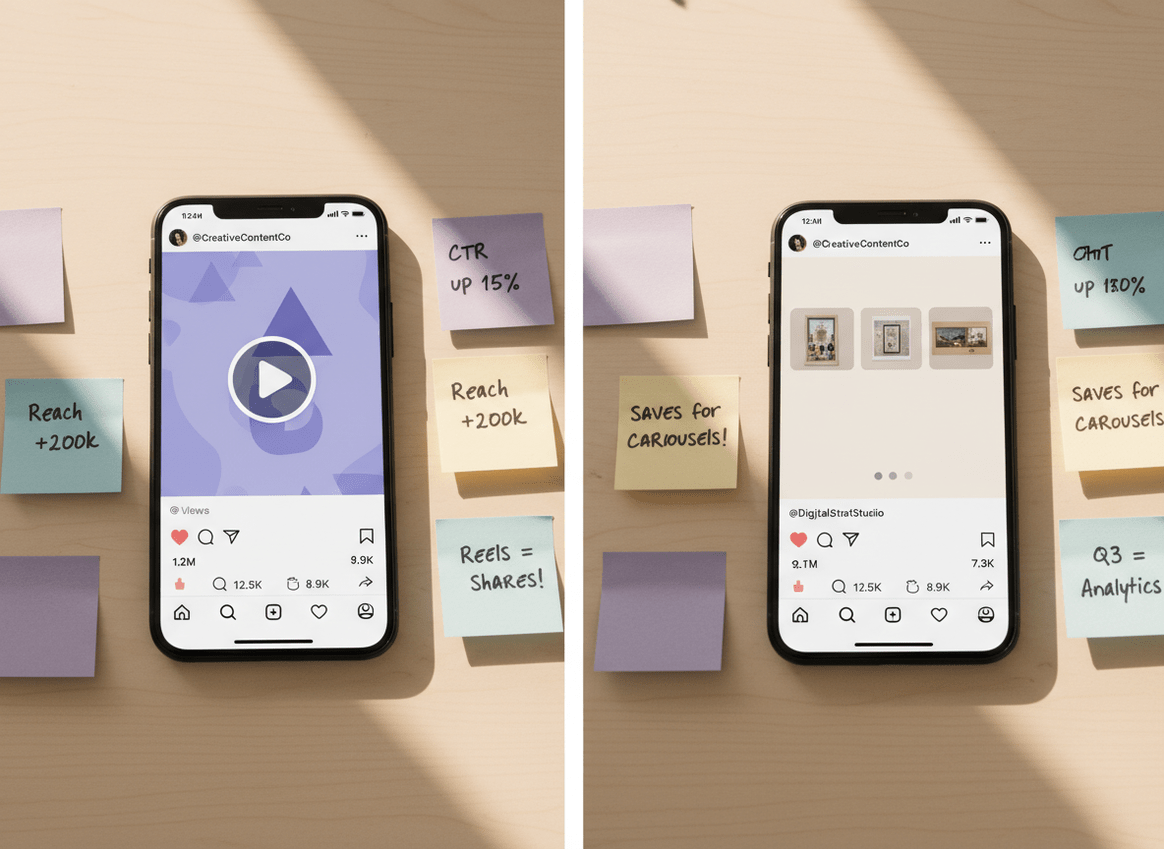
2) Engagement by format, not by date
Date-based reports are fine, but format-based reports are the fix for 2026. You want “average Saves per Reach on carousels” vs “average Shares per Reach on Reels.”
Chronological posting strategy is basically dead for growth. Painful, I know. But format decisions still move the needle.
3) Follower quality slices (ghosts, fans, and in-between)
Ghost followers aren’t always bots. A lot of them are just passive. Still, they can distort your engagement metrics and make your content look weaker than it is.
If you’re trying to diagnose this, read this guide on finding ghost followers on Instagram. It’s one of the few topics where being honest helps: you can’t “force” ghosts to engage, but you can stop optimizing for them.
4) Non-follower reach vs follower reach (especially for Reels)
This is the most telling 2026 split. When non-follower reach rises, your content is getting pulled into Suggested and discovery surfaces. When it’s mostly follower reach, you’re basically entertaining your existing base.
And to be clear, entertaining your base is not bad. It’s just a different goal.
5) Saves-to-reach and shares-to-reach “leaderboards”
Make a leaderboard of your last 30 pieces of content sorted by Saves per Reach and Shares per Reach.
Here’s the weird part: the posts that “won” on those ratios are often not the ones with the most likes. The first time I ran this for a creator selling templates, the top post by saves had mediocre likes but drove the most DMs. I felt dumb for not checking earlier.
Common mistakes I see with instagram engagement analytics tools
I’ve made some of these mistakes myself, so no judgement.
- Ignoring Reels metrics because “my audience likes photos.” Cool, but visibility lives in Reels for a lot of niches now.
- Only using native Insights and then realizing you can’t export anything clean for month-over-month comparisons.
- Comparing yourself to nobody. Benchmarks matter. Tools like Sotrender are built around that kind of context, and their roundups of Instagram analytics tools and benchmarking are useful if you’re shopping.
- Overreacting to day-to-day swings. Instagram data is noisy. Weekly patterns tell the truth more often than daily panic-checking does.
- Chasing one “best time to post” number. It changes by format and by audience behavior. Also, holidays and school schedules mess with it.
One more lived detail: if you check analytics too frequently (like, every hour), you’ll convince yourself your account is dying. I’ve done it. It’s not a good hobby.
Failure modes: where reports apps break or mislead you
This is the part most reviews skip, because it’s messy.
Failure mode #1: “Realtime” isn’t always realtime
Some tools update faster than others, and Instagram itself can lag. Where this gets weird is during a viral spike: you’ll see one dashboard showing a surge, and another still showing yesterday’s numbers. Don’t make campaign decisions off a stale screen.
Failure mode #2: You can’t always attribute unfollows to one post
You’ll want to. Everyone wants a clean villain. But unfollows often cluster after patterns: too many promos in a week, a topic shift, or repetitive Reels. A single post can trigger it, sure, but attribution is often fuzzy.
Limitations (what reports apps won’t tell you)
- They won’t tell you exactly why a specific person unfollowed. You’ll get timing, not motives.
- They can’t reliably detect shadowbans as a binary “yes/no.” You can infer distribution changes, but there’s no magic flag.
- Some insights are privacy-limited: you may see aggregate behavior, but not always user-level details for every metric.
Your mileage varies based on account type, region, and how heavily you post Stories vs Reels. Annoying, but true.
Picking the right tool: a practical shortcut (so you don’t overbuy)
If you’re solo, start with Instagram Insights and one tool that fills your biggest gap. If you’re a team, pick the tool that matches your workflow, not the one with the fanciest charts.
- If you need exports and recurring reports: Sprout, Iconosquare, or Hootsuite.
- If you need live campaign visibility: Keyhole.
- If your problem is follower cleanup and relationship tracking: a follower-focused tool is usually the right move.
If you’re in that last camp, this explainer on what a follower analyzer does for Instagram accounts helps you figure out whether you need audience analytics or relationship analytics (they’re not the same).
How Instagram Follower Tracker helps with follower insights from reports
A lot of instagram engagement analytics tools are great at content metrics, but they get fuzzy when you ask “okay, who left, who’s not following back, and how is that changing over time?” That’s the gap Instagram Follower Tracker was built to cover.
When I’m auditing an account, I like pairing a content analytics platform with a tool that’s focused on follower movement and audience hygiene. That’s where a password-free Instagram follower reports tracker that flags unfollows and non-followers fits in. It’s the difference between “my engagement dipped” and “my engagement dipped because 200 low-engagement followers piled in from a giveaway and then sat there doing nothing.”
It’s not trying to replace Sprout or Iconosquare. Honestly, it shouldn’t. It’s strongest for unfollow visibility, spotting non-followers, daily alerts, and syncing those changes across devices. The one thing it won’t do is magically tell you which creative concept to film next. (If it could, I’d be out of a job.)
If you want the broader category context, this post on using reports for Instagram to understand follower changes lays out the kinds of reports that are actually actionable versus the ones that just look pretty.
FAQ
What is the best analytics tool for Instagram?
The best tool depends on what you’re measuring: Instagram Insights is best for baseline accuracy, Sprout Social is great for team reporting and recommendations, and Iconosquare is strong for deep IG metrics and comparisons.
What tool is used to measure Instagram engagement?
You can measure engagement with native Instagram Insights or third-party instagram engagement analytics tools like Sprout Social, Hootsuite, or Iconosquare that calculate engagement rate, track saves/shares, and export reports.
How to find engagement analytics on Instagram?
Open Instagram, go to your professional dashboard (creator or business), then tap Insights to view reach, interactions, and audience metrics for posts, Stories, and Reels.
Can ChatGPT analyze Instagram profiles?
ChatGPT can analyze whatever data you paste in (like exported metrics or post performance), but it can’t reliably access private Instagram Insights on its own without you providing the data.
Why did my engagement drop even though my follower count increased?
This usually happens when new followers don’t engage (giveaways and Suggested spikes do this), so your interactions don’t scale with your audience size and your averages fall.
Are third-party Instagram analytics tools safe to use?
Some are safe and compliant, but avoid tools that ask for your Instagram password or promise impossible features; stick with reputable platforms and follower tracking tools designed to minimize account risk.
Conclusion (what to do next)
If you want hidden follower insights, don’t start by buying the fanciest dashboard. Start by choosing 2–3 metrics that reflect real behavior (Saves, Shares, non-follower reach), then map them against follower change over time.
Use native Insights as your baseline, add a reporting platform when you need exports and benchmarks, and use follower-focused tracking when your questions are about unfollows, non-followers, and audience quality. If that’s your pain point, Instagram Follower Tracker is worth a look at followertracker.app.