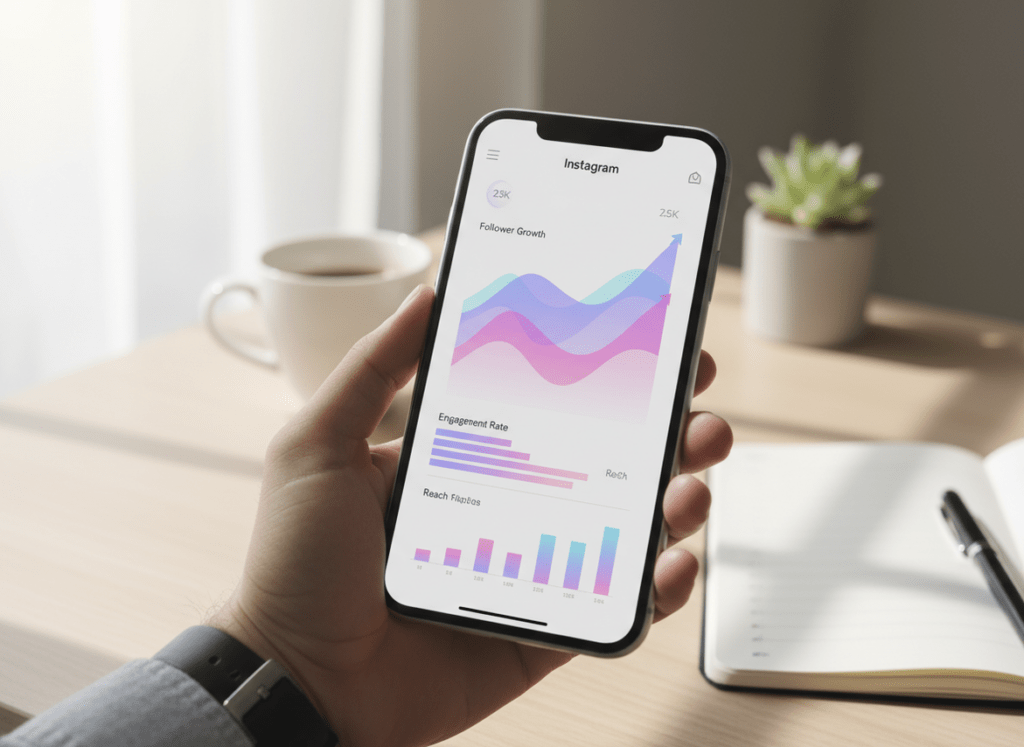
Instagram growth reports are only useful if they change what you post next week. The win isn’t “more data”, it’s spotting the one pattern that explains why a Reel popped off, why your follows dipped, or why your reach suddenly went weird.
I’ve been living inside Instagram Insights and third-party trackers for years (agency work, creator accounts, a couple of brands that post way too much). And honestly, most people pop open Insights, squint at a couple of charts for a minute, then shrug and go right back to guessing.
Here’s how I’d read Instagram analytics without overthinking it, what to look at, what it means, what to skip, and a simple way to turn those growth reports into content choices that usually move the needle.
TL;DR: Instagram analytics reports are only beneficial if you use them to inform your content strategy. If you track anything, track follows per 1,000 reach. It’s a quick gut check on whether your content is turning views into new followers, and it’ll usually show you where things start leaking. Try not to get hypnotized by the big numbers. Stick with the stuff you can actually act on, like what gets saves, replies, and shares, because that’s what tends to push engagement and reach.
What “Instagram Growth Reports” Actually Mean (And Why They’re Confusing)
When people say “Instagram reports app” they usually mean a mashup of three things:
- Reach and discovery (how many non-followers saw you, where they came from, which formats got pushed)
- Conversion (profile visits to follows, link taps, DMs, saves)
- Retention (who stuck around, who unfollowed, who never engages but still follows)
The confusing part is that Instagram shows pieces of this in different places (post insights, account insights, Reels insights), and the numbers don’t always “add up” in a way that feels intuitive.
One lived-detail thing I see a lot: on smaller accounts (say under 5k), a single Reel can swing your follow/unfollow numbers so hard that weekly trends look like a heart monitor. On bigger accounts, it’s the opposite: it can take a few days for the trend to show up cleanly, so people panic early and “fix” the wrong thing.
How It Works: Why Instagram Analytics Reports Predict Growth (When You Read Them Right)
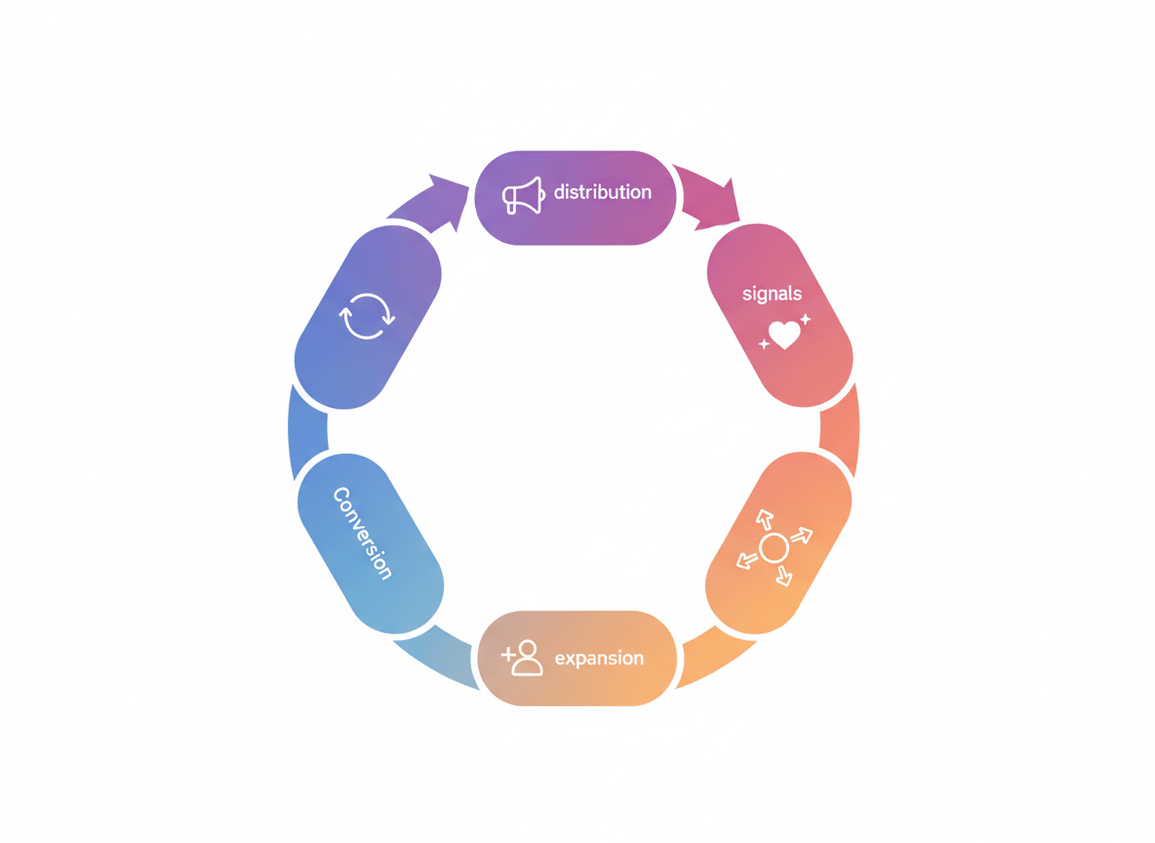
Instagram’s growth is basically a loop:
- Distribution: IG tests your content with a small pool (followers and sometimes non-followers).
- Signals: people watch, rewatch, save, share, comment, or bounce.
- Expansion: if signals are strong, IG shows it to more people (especially in Reels and Explore).
- Conversion: some viewers click your profile, some follow, some DM, some do nothing.
- Feedback: your future distribution depends on how consistently you repeat “good signals” without looking spammy or automated.
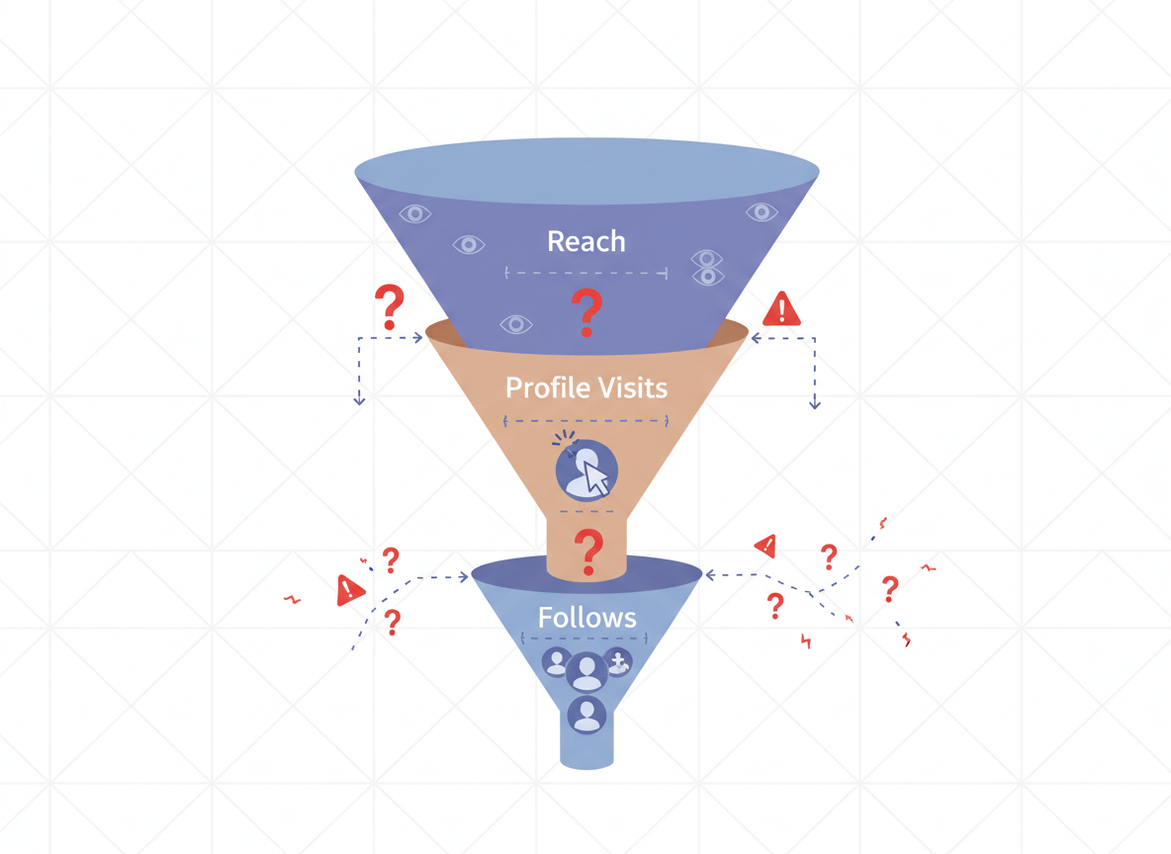
The reason reports help is simple: they show where the loop is breaking. Not enough reach? Content isn’t getting distributed. Plenty of reach but no follows? Your profile or positioning isn’t landing. Lots of followers but dead engagement? You’ve got a relevance problem (or ghost followers).
And yes, Instagram’s system in 2026 is way better at sniffing out fake behavior. If you’re still messing with auto-like/auto-follow tools… don’t. I’ve seen accounts get quietly throttled where everything “posts fine” but discovery dries up for weeks. It’s brutal.
The Only Metrics I’d Actually Use in Instagram Growth Reports (2026 Edition)
1) Follows per 1,000 Reach (Your Real Growth Conversion Rate)
Follower count alone is a vanity metric now. What matters is: when new people see you, do they decide you’re worth keeping?
A quick-and-dirty calculation I use:
- Follows per 1,000 reach = (new follows from a post or week / reach) x 1000
Counterintuitive truth: a post with lower reach can be better for growth if it converts like crazy. You’d think the “big reach” post is the hero, but I’ve had plenty of viral-ish Reels that pulled junk followers, then triggered an unfollow wave two days later. Not fun.
2) Shares and Saves (Not Likes) for Discovery
Likes are cheap. Shares and saves are the “this was useful or entertaining enough to keep” signal.
On accounts where Reels do well, I usually see this pattern: shares drive the initial burst, then saves keep it circulating longer. When the share-to-like ratio is strong, the algorithm tends to keep testing the content with new pockets of people.
3) Average Watch Time and 3-Second Hold (For Reels That Actually Travel)
If your Reel can’t hold attention early, the rest doesn’t matter. Period.
Where this gets weird: I’ve tested the same concept with two different hooks, same captions, same audio vibe. The version with a clearer first second got 2x the reach, even though the rest of the video was basically identical. That’s the algorithm doing “micro-behavior” evaluation in real time.
4) Profile Visits to Follows (Profile Conversion)
This is the cleanest “your positioning works” metric Instagram gives you.
- High visits + low follows = your bio, pinned posts, or content promise is unclear
- Low visits + decent follows = your content is doing the heavy lifting, but you’re not getting enough clicks (CTA issue)
5) Net Followers (Follows Minus Unfollows)
Net is what you can build on. Gross follows can look great while your audience quietly leaks out the back door.
And yeah, I learned this one the embarrassing way. Years ago I celebrated a “record follower week” on a client account. Then I checked the unfollows. Oof. Net was basically flat because the content attracted the wrong crowd.
6) Reach Split: Followers vs Non-Followers
If you’re trying to grow, you need non-follower reach. If all your reach is followers, you’re in a retention loop, not a growth loop.
Reels still dominate for non-follower reach, but carousels with strong saves can punch above their weight too, especially when the topic is searchable.
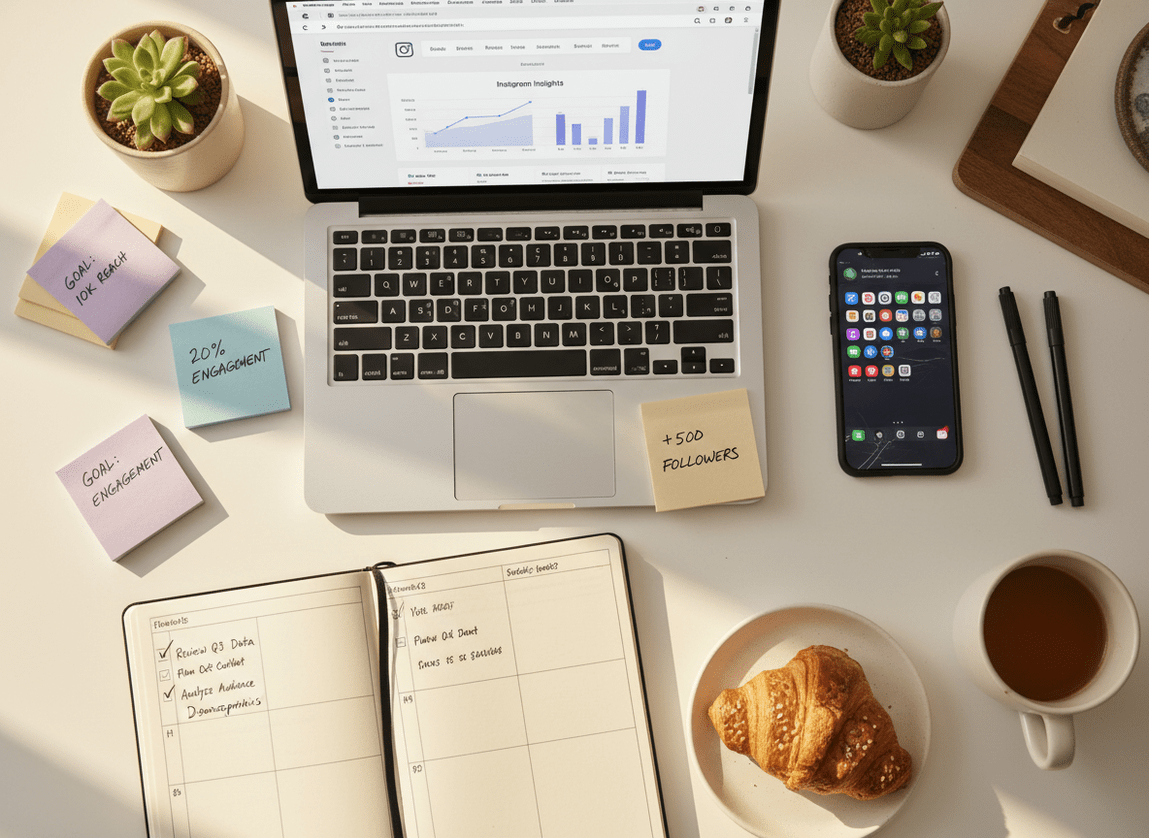
A Simple Biweekly Workflow for Instagram Growth Reports (That You’ll Actually Stick To)
I’m a big fan of biweekly reviews. Weekly can be too noisy, monthly is too slow. Biweekly is the sweet spot where you can see patterns without overreacting.
- Pick a window: last 14 days. Same days each time. Consistency matters because weekends vs weekdays skew everything.
- Pull your top 5 posts by non-follower reach (usually Reels). Screenshot the key stats: reach, average watch time, shares, saves, follows.
- Pull your top 5 posts by follows gained. These are often not the same as “top reach” posts. That mismatch is the insight.
- Find the “format winner” for the next 2 weeks: one hook style, one topic angle, one content length range. Don’t overcomplicate it.
- Set one micro-goal: raise shares, raise follows per 1,000 reach, or fix profile conversion. One goal. Not five.
- Do a quick audience quality check: are you getting meaningful comments/DMs, or just empty “nice” comments? (I know, subjective. Still important.)
- Plan your next 6 posts based on what won, not what you feel like posting at 11:47pm on a Tuesday.
If you want a deeper breakdown of how to package this into something repeatable, the Insights tracking workflow article lays it out in a way you can copy-paste into your notes app.
Turning Reports Into Action: Fix the Bottleneck (Not the Whole Account)
Most growth plateaus happen because one part of the loop breaks. You don’t need a total rebrand. You need to diagnose.
If reach is down
- Check posting consistency. Instagram rewards steady output, and punishes bursts followed by silence. That’s been extra true lately.
- Check “early retention” on Reels. If the first second is vague, IG stops testing it fast.
- Check if you’re late to trends. Using trending audio is fine, but copying exact formats is weaker now. Put your own spin on it.
Instagram’s native AI trend suggestions can help, but don’t get hypnotized by them. I’ve watched creators chase “trending” and end up with off-brand content that attracts the wrong audience, then tanks net growth.
If reach is fine but follows are low
- Your profile promise is unclear. Bio, pinned posts, and highlights should tell people what they get by following.
- Your content is entertaining but not “sticky.” Add series titles, recurring segments, or a clearer niche lane.
- You’re missing a CTA. Not “follow for more” spam. A real reason: “If you’re building X, I post Y every week.”
One weird-but-real observation: accounts that post “micro-dramas” or story-driven content often get tons of profile taps, but lower follow conversion unless the bio clearly explains what the account is about. People enjoy the episode, then forget why they should follow. Happens a lot.
If you’re gaining followers but engagement is slipping
This is usually an audience mismatch. You’re pulling people who like the viral moment, not the broader theme.
If you want to quantify this, read up on how engagement rate is calculated on Instagram and track it alongside net followers. It’s a good “quality control” pair.
What’s Working in 2026 (Based on What the Reports Keep Showing)
Trends come and go, but the reports keep rewarding the same behavior patterns:
- Consistent posting cadence beats occasional “masterpieces.” Not always, but most of the time.
- Original takes on trends outperform copycat templates. You can borrow the structure, but the viewpoint has to feel like you.
- Creator partnerships with ROI matter more than “biggest creator possible.” Similar-sized collabs convert better in a lot of niches.
- Employee advocacy is sneaky powerful for brands. Real humans posting “from inside the company” creates trust signals paid ads can’t fake.
- Cozy aesthetics, nostalgic remixes, and calming content are pulling engagement, especially with Gen Z burnout vibes.
If you want a broader macro view, I keep an eye on Hootsuite’s social trends research to sanity-check what I’m seeing in my own dashboards.
Common Mistakes I See When People Use Instagram Analytics Reports
These are the traps that waste the most time.
- Chasing vanity spikes. One big Reel doesn’t mean you “cracked the algorithm.” It means that one piece hit. Repeatable patterns matter.
- Reading daily stats like they’re stock prices. I’ve done this. It made me miserable. Biweekly is calmer and more accurate.
- Ignoring net followers. If you’re bleeding unfollows, your content-to-audience match is off.
- Switching niches every time a post flops. That’s not strategy, that’s anxiety.
- Using automation. Instagram’s detection is sharper now, and you can get quietly limited without a clear warning.
And a quick tangent: a lot of “analytics tools” still ask for your Instagram password. Please don’t. I’ve seen accounts get flagged, sessions revoked, and access locked at the worst possible time (like mid-launch). Not worth it.
Failure Modes: Where Instagram Growth Reports Fall Apart
This stuff isn’t magic. There are a couple places it breaks.
- Low volume accounts: If you post once a week, your data is too sparse. The “top post” is just… the post. Your report won’t be stable enough to drive decisions.
- Trend turbulence: When you hit a trend wave, the audience coming in is mixed quality. Your conversion metrics can look great for 48 hours, then normalize hard.
Also, sometimes Insights just lags or glitches. I hate saying that, but it’s true. I’ve had days where Reels metrics update hours late, and if you’re making decisions in that window, you’re basically driving in fog.
Limitations: What Instagram Growth Reports Won’t Tell You
Instagram analytics reports won’t tell you why someone unfollowed, only that they did. And they won’t show the full picture of “silent” brand impact like word-of-mouth or someone binge-watching three weeks later and then converting.
One more caveat: if you’re running paid ads or big giveaways, your organic growth metrics get polluted. You can still learn from the data, but you’ve gotta label those periods so you don’t copy the wrong playbook afterward.
How Instagram Follower Tracker Helps With Instagram Growth Reports
Instagram Insights is good at post-level performance. Where it gets annoying is audience movement over time: unfollows, non-followers you’re still following, ghost followers that never engage. That’s the stuff that quietly drags your growth curve down.
That’s why I like using Instagram Follower Tracker alongside Insights. It’s built to show audience changes clearly, without the sketchy “give me your password” nonsense. If you’re trying to tighten up your reporting, an Instagram follower analytics tracker that monitors growth and unfollows fills in the gaps that Insights doesn’t make obvious.
Two lived-detail notes from using tools like this across different accounts: on larger accounts, unfollow detection and audience sync can take longer just because there’s more movement to process. And on fast-growth weeks, daily alerts are way more useful than you’d think, because you can connect an unfollow spike to a specific post instead of guessing later.
If you want to go deeper on the reporting side, check out this breakdown of Instagram reporting dashboards and what to include. And if your main goal is straight-up growth, the Instagram follower growth guide pairs well with the biweekly review workflow above.
One honest limitation: no tool can see private account engagement perfectly, and nobody can read minds. A tracker can show who left and who doesn’t engage, but it can’t tell you the personal reason someone stopped caring.
If you’re the type who likes to audit follower quality, the follower analyzer write-up is worth a skim.
FAQ
Is there a way to see Instagram growth?
Yes, you can see growth in Instagram Insights by checking accounts reached, profile visits, and follower changes over a selected date range, then comparing those numbers biweekly or monthly.
How often should I review instagram growth reports?
Biweekly is the best balance for most accounts because it smooths out daily noise but still lets you adjust content quickly.
What’s the most important metric for growth: reach or followers?
Neither alone; the useful metric is how many followers you earn per amount of reach (for example, follows per 1,000 reach), because it captures both discovery and conversion.
Do Reels still matter for growth in 2026?
Yes, Reels still drive the most non-follower reach for most niches, but the best-performing accounts tend to remix trends with an original angle instead of copying templates.
Why did my followers go up but engagement go down?
That usually means you attracted a mismatched audience from a viral post or trend, so you gained followers who aren’t actually interested in your core content.
Conclusion: Use Reports to Make One Smart Change Every Two Weeks
If you want Instagram growth, stop treating analytics like a scoreboard and start using it like a diagnosis. Track reach split (followers vs non-followers), follows per 1,000 reach, and net followers, then double down on what converts, not just what “went big.”
Keep your workflow simple: review every two weeks, pick one bottleneck, run one experiment, repeat. And if you want cleaner audience movement data (unfollows, non-followers, ghost followers) to complement Insights, Instagram Follower Tracker is worth a look at followertracker.app.
External reading I reference when calibrating strategy: this 2026 Instagram growth overview plus ongoing social trend reporting for bigger platform shifts.